

Google I/Oで発表されたLighthouse3.0は、非常に便利なウェブページのチェックツール。表示高速化を考えている方は一度試してみよう。
Webパフォーマンスだけでなく、様々な対策状況をチェックしてくれるGoogleのLighthouseですが、バージョン3.0がアナウンスされました。
2.9系との違い
ロゴが変わったり、結果レポートのレイアウトが変わったりしています。機能面では利用者側が大きく変更されたという印象はありません。現状、3.0を利用するにはコマンドラインベースでしか利用できないため、Chromeの拡張機能版もアップデートまで時間がかかりそうです。
処理速度
3.0は高速化が計られています(処理待ちが短いなど)。実際に3.0をコマンドラインで利用しましたが、かなり速いです。コマンドライン版は、コマンドラインでURLを入力し、ブラウザで結果が表示されます。
レポートUI
刷新されました。わかりやすさは今まで通りで良いです。サクサクと動作するようになったので、使っていて気持ちいいです。
スコアリング
スコアリングに変更が入っています。そのため、2.9系の結果と、3.0系の結果は異なる箇所があります。アイデアマンズブログでは、Performanceの部分にスコアの違いがありました。
CSV出力
今までのエクスポートはJSONのみでした。3.0からはCSVも指定できるようになりました。
JSON出力の変更
今まで出力されていたJSONのレイアウトが変わるようです。これは開発で利用している場合、注意が必要ですね。
First Contentful Paint
画面描画の部分が、標準でスクリーンショットを撮るようになったようです。また、今までは細かく時系列に取得されていたスクリーンショットですが、いい感じに間引きされていて、わかりやすくなりました。
First Interactive ➡ First CPU Idle
メトリクスが変更のようです。今までは、ユーザーの操作ができるようになるまでが計測でしたが、CPUがアイドル状態になるまでに変更になったようですね。ここも注意が必要そうです。
Node.js版での注意点
Node.jsの必要なバージョンは、v8以降のようです。自分はv10系の一番新しいものを入れて動かしました。
アイデアマンズブログで試してみた
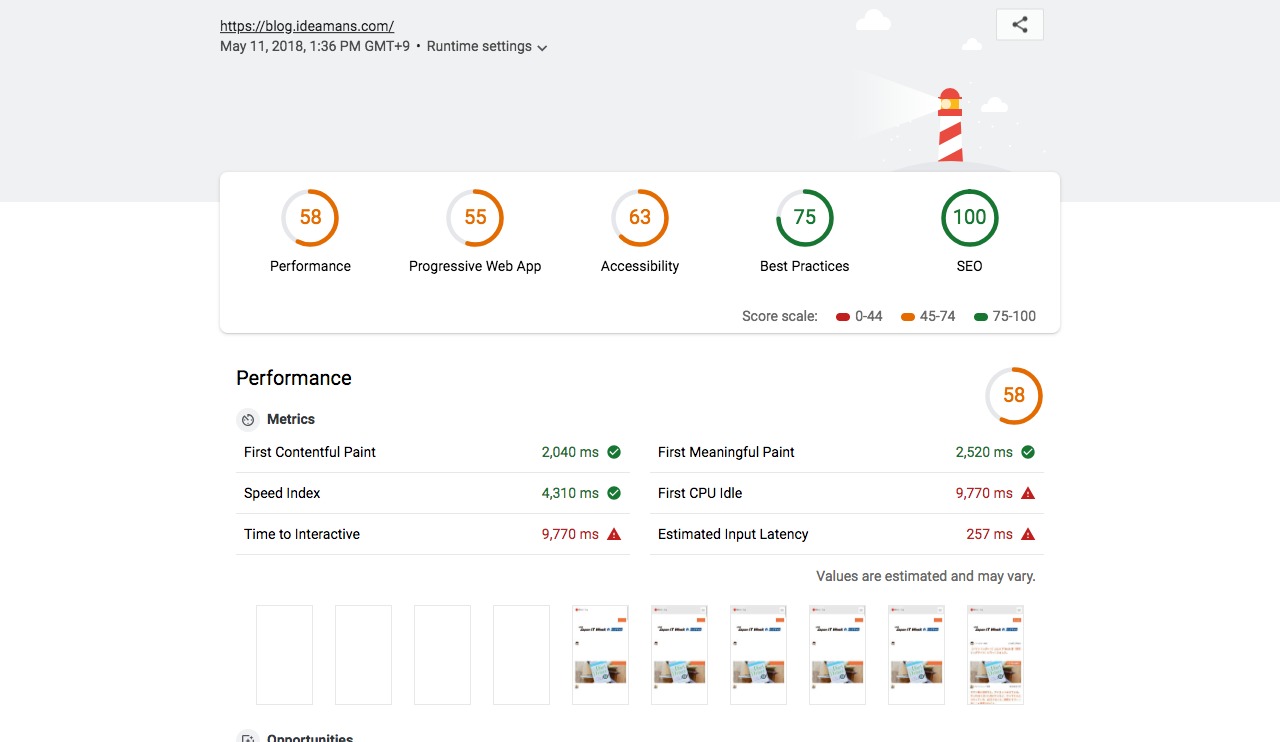
早速試してみた。調整しないといけないところは多そう。SEOが100点になるのは、そういうものらしいです。
上の画面キャプチャの一番下にあるスクリーンショットが、前よりも見やすくなりました。以前はかなり細かく時系列で取得されていたっぽく、細かすぎた印象だったのですが、サマリーされて見やすいです。
lighthouse --helpをみてみる
長いので、テキストエディタなどにコピペしてみてください。
$ lighthouse --help
lighthouse

Logging:
  --verbose  Displays verbose logging                                                                                                       [真偽]
  --quiet    Displays no progress, debug logs or errors                                                                                     [真偽]

Configuration:
  --save-assets                  Save the trace contents & screenshots to disk                                                              [真偽]
  --list-all-audits              Prints a list of all available audits and exits                                                            [真偽]
  --list-trace-categories        Prints a list of all required trace categories and exits                                                   [真偽]
  --additional-trace-categories  Additional categories to capture with the trace (comma-delimited).
  --config-path                  The path to the config JSON.
  --preset                       Use a built-in configuration.                                 [選択してください: "full", "perf", "mixed-content"]
  --chrome-flags                 Custom flags to pass to Chrome (space-delimited). For a full list of flags, see http://bit.ly/chrome-flags
                                 Additionally, use the CHROME_PATH environment variable to use a specific Chrome binary. Requires Chromium version
                                 54.0 or later. If omitted, any detected Chrome Canary or Chrome stable will be used.             [デフォルト: ""]
  --port                         The port to use for the debugging protocol. Use 0 for a random port                               [デフォルト: 0]
  --hostname                     The hostname to use for the debugging protocol.                                         [デフォルト: "localhost"]
  --max-wait-for-load            The timeout (in milliseconds) to wait before the page is considered done loading and the run should continue.
                                 WARNING: Very high values can lead to large traces and instability
  --enable-error-reporting       Enables error reporting, overriding any saved preference. --no-enable-error-reporting will do the opposite. More:
                                 https://git.io/vFFTO
  --gather-mode, -G              Collect artifacts from a connected browser and save to disk. (Artifacts folder path may optionally be provided).
                                 If audit-mode is not also enabled, the run will quit early.
  --audit-mode, -A               Process saved artifacts from disk. (Artifacts folder path may be provided, otherwise defaults to ./latest-run/)
  --only-audits                  Only run the specified audits
  --only-categories              Only run the specified categories
  --skip-audits                  Run everything except these audits

Output:
  --output       Reporter for the results, supports multiple values        [配列] [選択してください: "json", "html", "csv"] [デフォルト: ["html"]]
  --output-path  The file path to output the results. Use 'stdout' to write to stdout.
                 If using JSON output, default is stdout.
                 If using HTML output, default is a file in the working directory with a name based on the test URL and date.
                 If using multiple outputs, --output-path is ignored.
                 Example: --output-path=./lighthouse-results.html
  --view         Open HTML report in your browser                                                                                           [真偽]

オプション:
  --help                               ヘルプを表示                                                                                         [真偽]
  --version                            バージョンを表示                                                                                     [真偽]
  --blocked-url-patterns               Block any network requests to the specified URL patterns
  --disable-storage-reset              Disable clearing the browser cache and other storage APIs before a run                               [真偽]
  --disable-device-emulation           Disable Nexus 5X emulation                                                                           [真偽]
  --throttling-method                  Controls throttling method                           [選択してください: "devtools", "provided", "simulate"]
  --throttling.rttMs                   Controls simulated network RTT (TCP layer)
  --throttling.throughputKbps          Controls simulated network download throughput
  --throttling.requestLatencyMs        Controls emulated network RTT (HTTP layer)
  --throttling.downloadThroughputKbps  Controls emulated network download throughput
  --throttling.uploadThroughputKbps    Controls emulated network upload throughput
  --throttling.cpuSlowdownMultiplier   Controls simulated + emulated CPU throttling
  --extra-headers                      Set extra HTTP Headers to pass with request

例:
  lighthouse  --view                                                    Opens the HTML report in a browser after the run completes
  lighthouse  --config-path=./myconfig.js                               Runs Lighthouse with your own configuration: custom audits, report
                                                                             generation, etc.
  lighthouse  --output=json --output-path=./report.json --save-assets   Save trace, screenshots, and named JSON report.
  lighthouse  --disable-device-emulation --throttling-method=provided   Disable device emulation and all throttling
  lighthouse  --chrome-flags="--window-size=412,732"                    Launch Chrome with a specific window size
  lighthouse  --quiet --chrome-flags="--headless"                       Launch Headless Chrome, turn off logging
  lighthouse  --extra-headers "{\"Cookie\":\"monster=blue\",            Stringify'd JSON HTTP Header key/value pairs to send in requests
  \"x-men\":\"wolverine\"}"
  lighthouse  --extra-headers=./path/to/file.json                       Path to JSON file of HTTP Header key/value pairs to send in requests

For more information on Lighthouse, see https://developers.google.com/web/tools/lighthouse/.
画像の最適化チェックは、LightFile Simulatorがオススメ
Googleのチェックツールでは、画像表示サイズに適しているかはチェックしますが、画質最適化されているかどうかのチェックができません。LightFile Simulatorを使えば、JPG画像の画質最適化のチェックができます。

無料で使える画像最適化チェックシミュレータ。チェック結果がレポートになるので、URLを共有すればみんなでみれる。
最後に
非常に便利なツールのLighthouse。その名の通り「灯台」のように、夜の海のように真っ暗なところから、何かを発見できるツールです。表示高速化やWebパフォーマンスなどの最適化は、しっかりと数値をマーキングすることが重要なので、指標としてLighthouseを利用するのは非常に有効だと思います。

担当サービス 画像最適化ツール LightFile

フォローしませんか?